If an organization running SAP workloads in a corporate data center and leadership is asking, “What would it cost to move this to AWS?” you need more than a rough estimate. You need a structured, defensible executive presentation backed by real AWS pricing data.
In this post, I detail the step-by-step approach I used as a Cloud Architect at Kloudbyte Technology, from breaking down the on-premises environment to producing a polished executive cost model using the AWS Pricing Calculator, Excel, and PowerPoint.
The Business Context
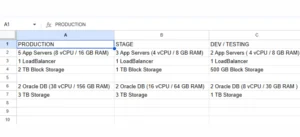
Kloudbyte Technology runs SAP workloads in its corporate data center across three environments:
- Production (Prod) — the live, customer-facing SAP system
- Stage/Homologation (HML) — the pre-production validation layer
- Development & Testing (Dev/Test) — the sandbox and QA environment
Each environment includes application servers, a load balancer, block storage, NFS storage, and an Oracle database, a fairly standard SAP architecture for a mid-to-large enterprise.
The executive mandate: estimate the 3-year total cost of ownership (TCO) on AWS, the minimum investment horizon leadership uses for infrastructure ROI decisions.
Step 1 — Sizing the Production EC2 Instances
The initial phase involves mapping existing on-premises server hardware specifications to AWS EC2 instance families with comparable compute instance types.
For Production, the application servers require:
8 vCPUs and 16 GB of RAM.
5 application server instances needed,
I selected the t3a.2xlarge (8 vCPU / 32 GB), the closest available fit in the t3a family, which is AMD-based and cost-effective for steady-state workloads.
The key pricing decisions:
- Region: Northeast Ohio (US East) for the lowest data transfer and alignment with business operations.
- Workload type: Constant usage SAP production systems run 24/7
- Payment model: 3-year Compute Savings Plans offer significant cost reductions (40–60%) for always-on production workloads versus On-Demand.
Storage: Production requires 2 TB of block storage distributed across 5 instances, equivalent to 400 GB per instance using General Purpose SSD (gp2) EBS volumes.
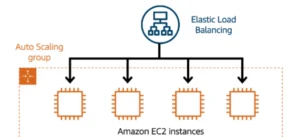
Step 2 — Load Balancer Estimation (All Environments)
I consolidated all load balancers into a single service estimate, assigning one ALB to each environment.
Using AWS Elastic Load Balancing (Application Load Balancer):
- 3 ALBs — one each for Prod, HML, and Dev/Test
- Processed throughput: 2 GB/hour per ALB
- Request rate: approximately 100 requests/second per ALB
The ALB pricing model is based on Load Balancer Capacity Units (LCUs), which account for new connections, active connections, processed bytes, and rule evaluations. Estimating these accurately from your current traffic metrics provides leadership with a defensible number rather than a guess.
Step 3 — NFS Storage with Amazon EFS
SAP uses shared NFS storage for file systems such as transport directories, interfaces, and logs. Instead of a dedicated NFS server, use AWS EFS. It’s fully managed, elastic, and Multi-AZ by default.
The storage requirements across environments:
- Prod: 1 TB
- HML: 500 GB
- Dev/Test: 250 GB
- Total: 1,750 GB of Standard Storage on EFS
EFS Standard Storage pricing in US East Ohio is applied per GB-month, making this a straightforward line item in the estimate.
Step 4 — HML and Dev/Test EC2 Instances
Non-production environments are sized smaller, which directly reduces costs:
- HML: 3 servers × 4 vCPU / 8 GB RAM.
- Dev/Test: 2 servers × 4 vCPU / 8 GB RAM.
- Combined: 5 instances of t3a.xlarge (4 vCPU / 16 GB)
Storage per instance:
- HML: 1 TB / 3 instances = 333 GB.
- Dev/Test: 500 GB / 2 instances = 250 GB.
- Blended across 5 instances: 300 GB per instance on gp2 EBS.
The same 3-year Compute Savings Plan applies here, ensuring non-production systems also benefit from the committed-use discount.
Step 5 — Oracle Database on Amazon RDS (All Environments)
This is typically the most expensive and most scrutinized part of any SAP migration cost estimate. Oracle licensing and database infrastructure costs deserve careful attention.
Production (RDS for Oracle — Multi-AZ)
- 2 nodes with 38 vCPU / 156 GB RAM → mapped to db.m4.10xlarge (40 vCPU / 160 GB)
- Multi-AZ deployment — mandatory for SAP production databases to meet availability SLAs
- Storage: 3 TB total → 1,500 GB gp2 per instance
- Backup storage: 3,000 GB (equal to total DB size — a conservative baseline)
Homologation (RDS for Oracle — Single-AZ)
- 2 nodes with 16 vCPU / 64 GB RAM → db.m4.4xlarge (16 vCPU / 64 GB)
- Single-AZ — acceptable for non-production, significantly reduces cost
- Storage: 1,500 GB gp2 per instance, 3,000 GB backup
Dev/Test (RDS for Oracle — Single-AZ)
- 2 nodes with 8 vCPU / 30 GB RAM → db.m3.2xlarge (8 vCPU / 30 GB)
- Single-AZ
- Storage: 500 GB gp2 per instance, 1,000 GB backup
The Multi-AZ vs. Single-AZ decision between Prod and lower environments is one of the highest-leverage cost-optimization choices in this estimate. Multi-AZ essentially doubles the cost of a database instance in exchange for synchronous replication and automatic failover.
Step 6 — AWS Support Plan
For a production SAP workload, the AWS Enterprise Support Plan is the appropriate recommendation. The business requirements driving this choice are:
- Access to multiple AWS support engineers via email and phone, 24/7
- Technical response time of 15 minutes or less for business-critical issues
- Proactive guidance from a Technical Account Manager (TAM)
Even if the company doesn’t currently hold an Enterprise Support contract, this cost must be included in the executive estimate, because SAP production systems require that level of response time. Leaving it out is an omission that leadership will eventually discover.
Building the Executive Presentation
With all service estimates captured in the AWS Pricing Calculator, I exported the data as a CSV file, brought it into Excel to build the financial model, and then into PowerPoint for the executive presentation.
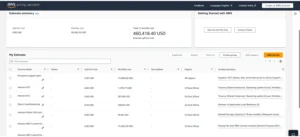
The presentation covers two primary views that executives care about:
1. Monthly Cost — Visualized as a bar or pie chart broken down by environment (Prod / HML / Dev/Test) and service category (Compute, Storage, Database, Networking, Support). This answers the question: “What does this cost us every month?”
2. Annual Cost — The monthly figures are annualized, giving leadership the year-one and steady-state cost picture. This answers: “What’s the annual budget impact?”
3. 3-Year TCO — The aggregate investment the executive team is approving. This is the number that gets compared against the cost of continuing to run on-premises, factoring in data center lease costs, hardware refresh cycles, and operational headcount.
Always include your name and job title in the presentation. An executive cost estimate without a named owner doesn’t carry the same weight in a boardroom.
Why This Approach Works for Executives
The AWS Pricing Calculator gives you a defensible, line-item estimate that you can export and version-control. Importantly, the Compute Savings Plans commitment at 3 years aligns with the ROI time horizon your executives are using, so the numbers speak directly to the business case they’re evaluating.
Breaking costs down by environment matters because executives often want to phase a migration to the cloud, starting with Dev/Test, then HML, then Prod. Your estimate needs to support that conversation.
And including support costs upfront demonstrates Cloud Architecture maturity. Nothing erodes trust in a cost model faster than discovering a significant line item was omitted.
Conclusion
A named, structured executive presentation separates a Cloud Architect’s deliverable from a rough back-of-napkin estimate. To meet executive ROI expectations and maximize discounts, we use Compute Savings Plans (3-year) for all EC2 instances. In addition, we deploy Oracle RDS as Multi-AZ in Production and Single-AZ in lower environments to differentiate costs. Furthermore, Amazon EFS cleanly replaces on-premises NFS servers, eliminating the need to manage shared storage infrastructure, and Enterprise Support is included in SAP production cost estimates. Finally, after exporting from AWS Pricing Calculator, we built a model in Excel and presented it in PowerPoint with both monthly and annual cost visualizations.
Have questions about your own SAP migration cost estimation? Drop them in the comments below.